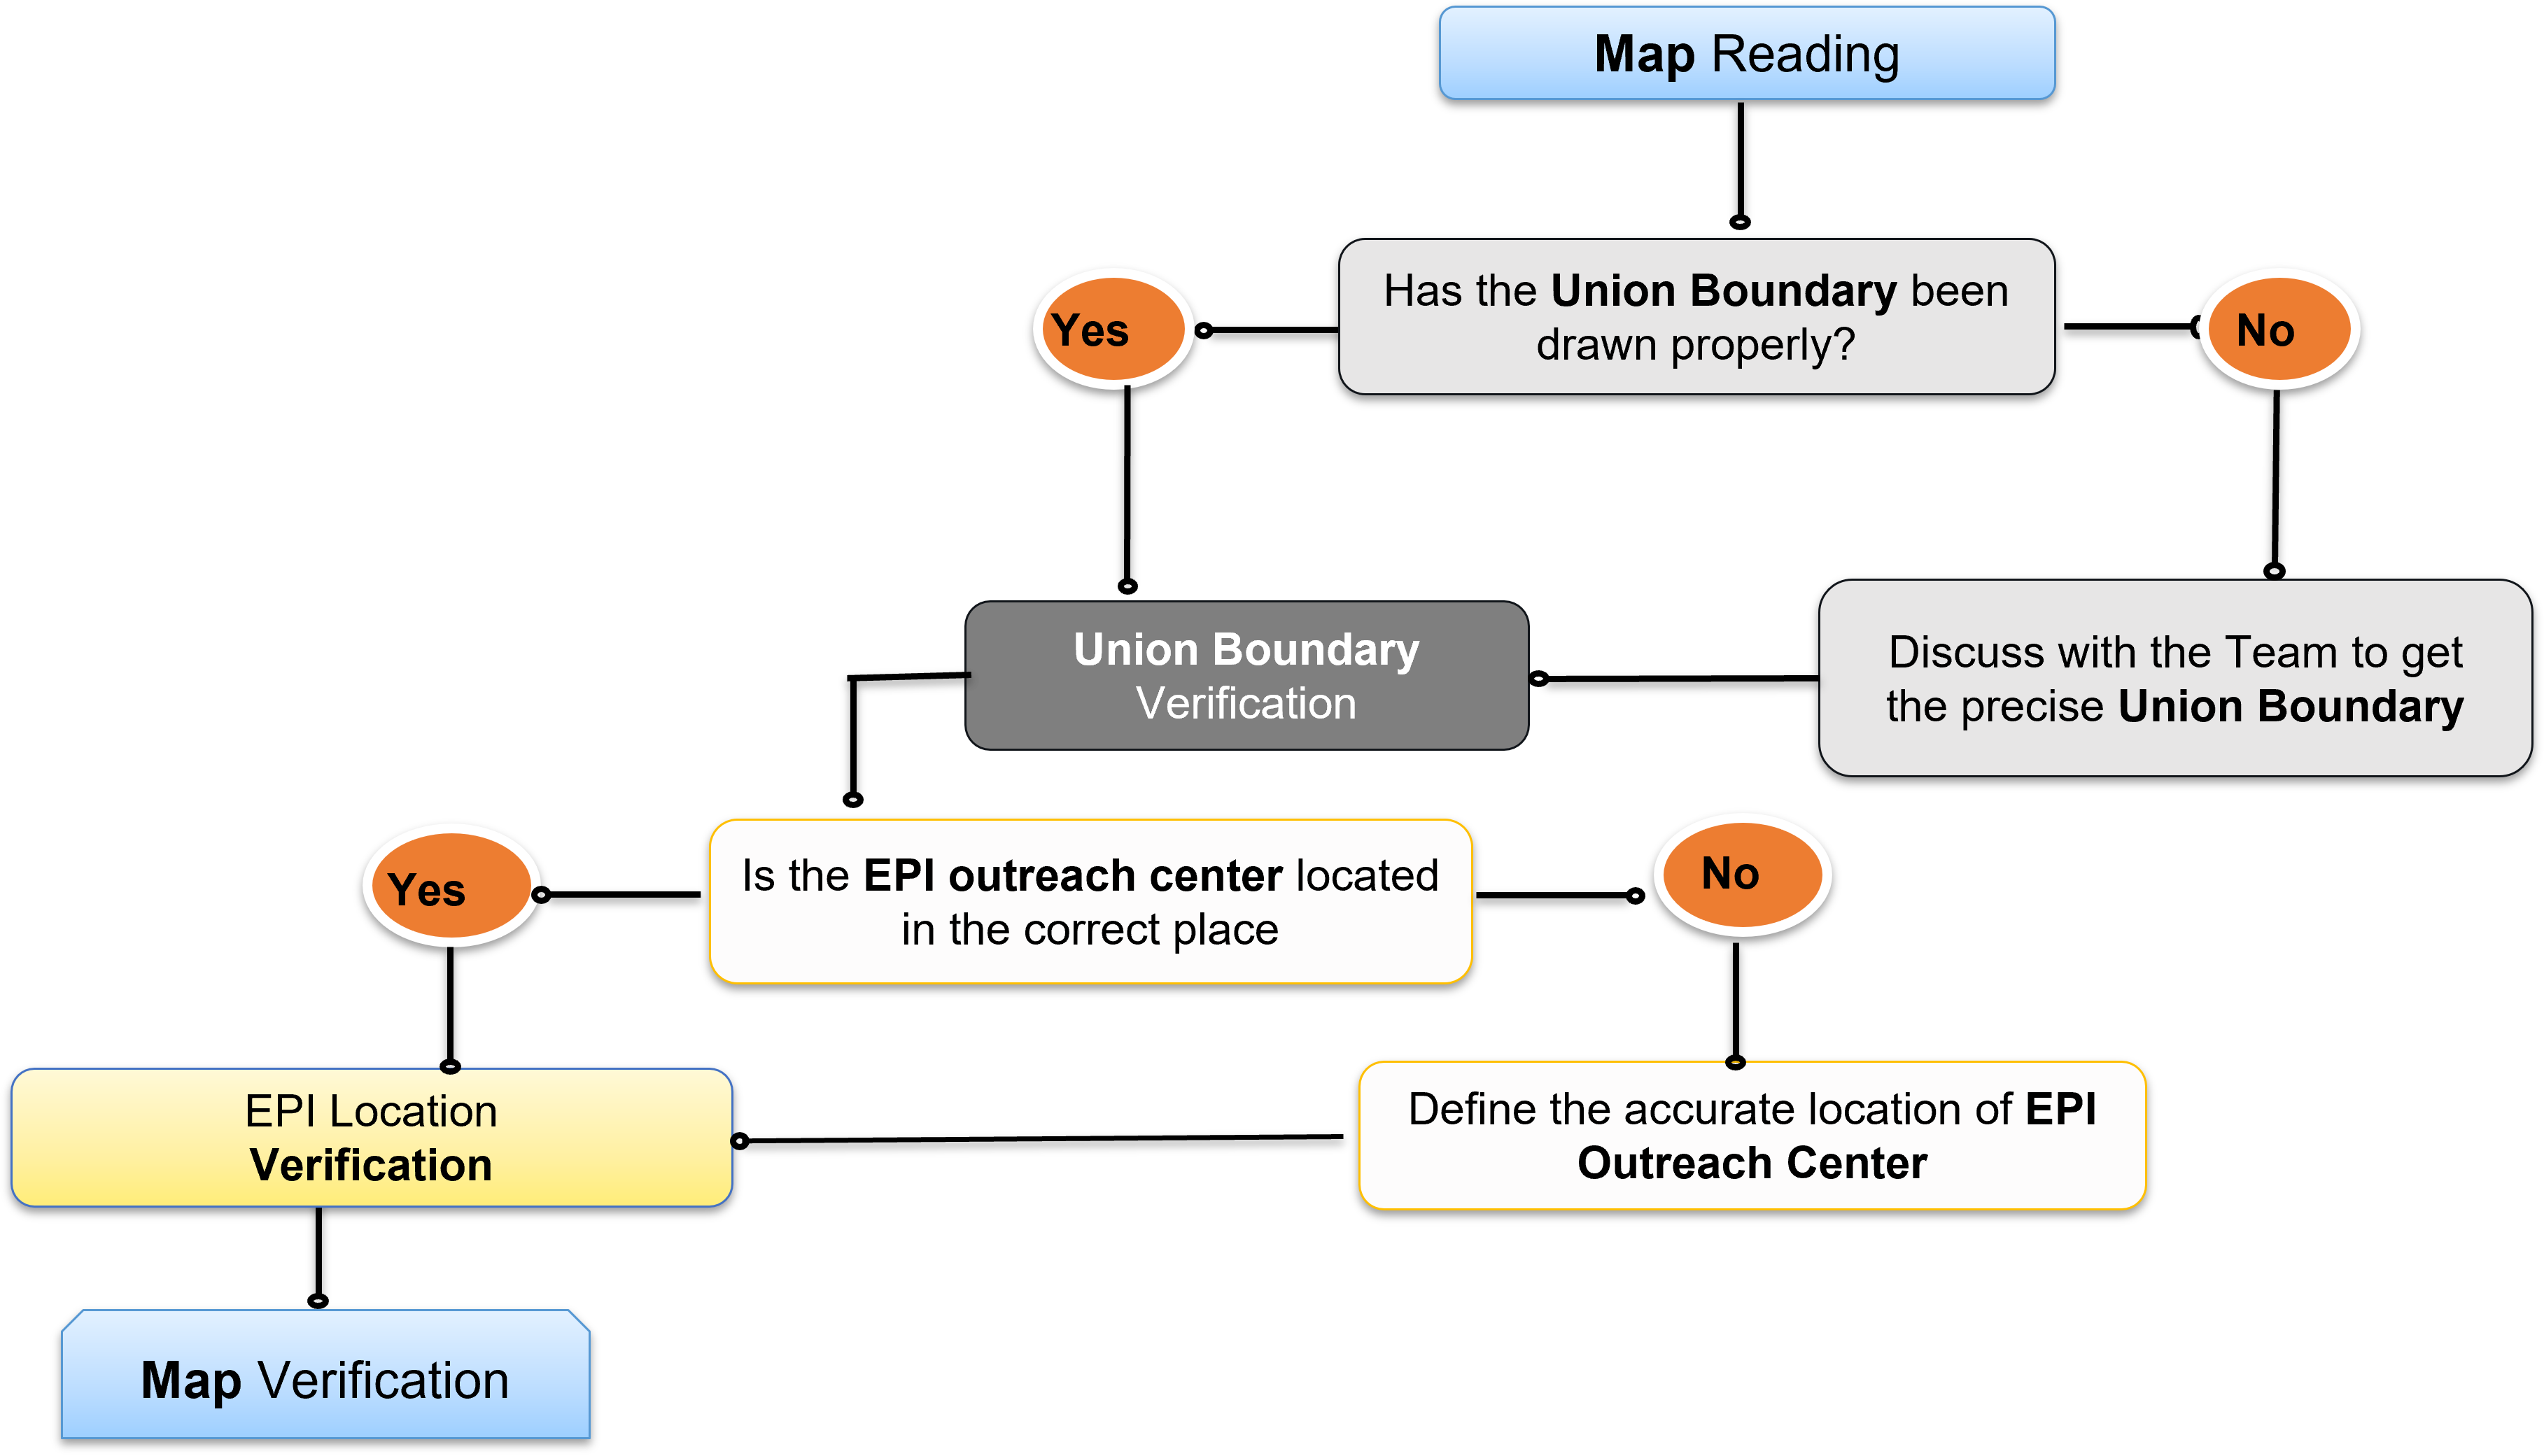
Updated Union Boundary
Verified administrative boundaries

Digital transformation of immunization data collection

Create data collection forms using KoBo Toolbox/ODK for EPI geolocation
Train front line staff on mobile data collection tools and procedures
Collect data using mobile apps (KoBo Toolbox/ODK Survey)
Capture and integrate GPS coordinates to accurately identify and map locations
Extract and prepare EPI microplan data from DHIS2 server for integration
Clean, compile to CSV and SHP, and integrate with DHIS2 orgunit UID

Basic introduction to KoboToolbox platform and functions
Knowledge on point data, GPS coordinates, and survey forms
Real-time form creation, deployment, and data submission
Practical field data collection for EPI centers
Group discussion, challenge identification, and Q&A

From DHIS2 orgunit UID & orgname extracted and stored in the database for integration with geo-database

Outreach Center Geodata Collected from field as per detail microplan and session plan.

After integration DHIS2 and Kobo Data, Outreach center Geodata Preparation is complete
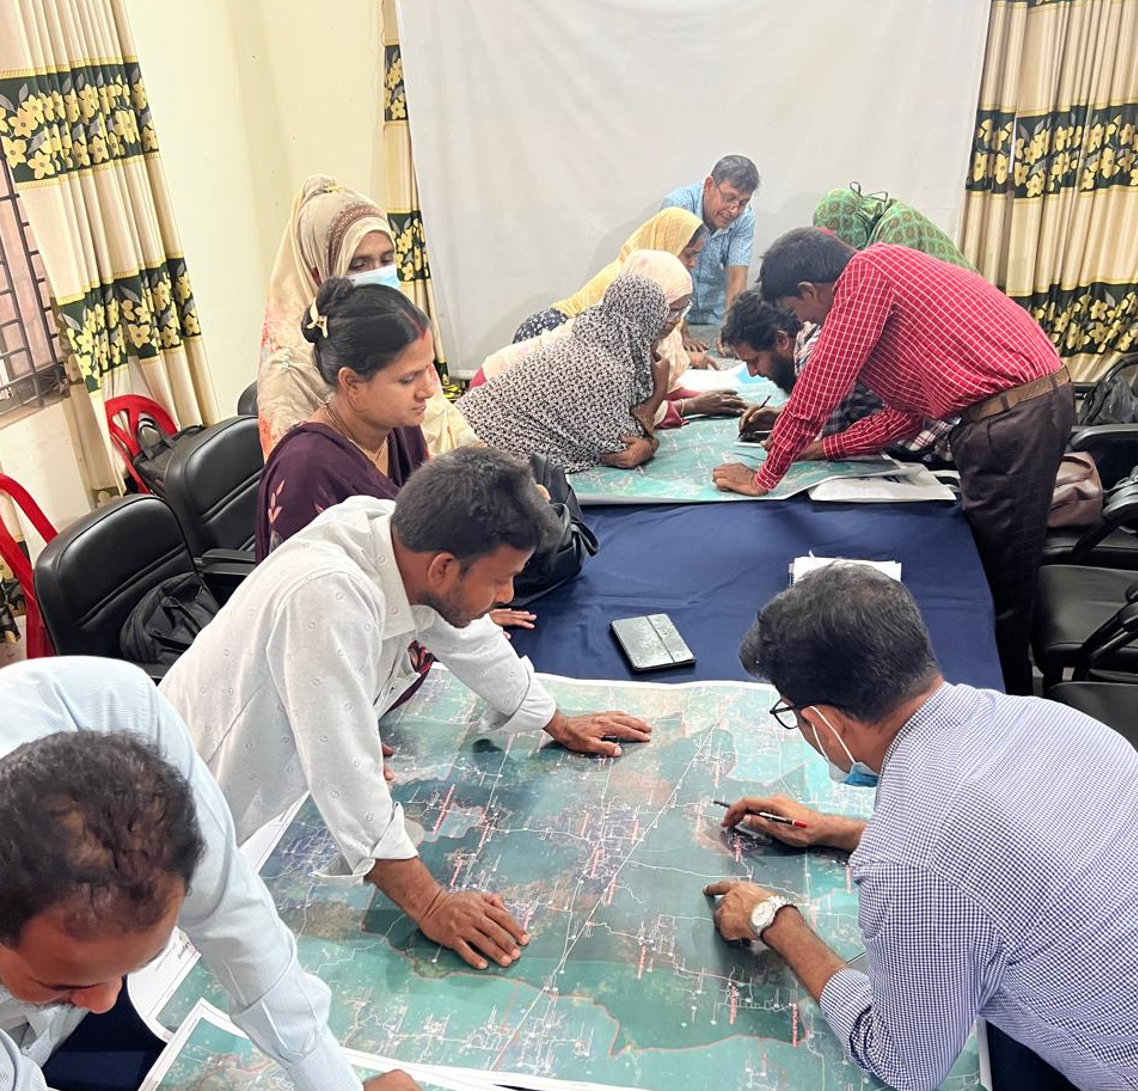
Participatory boundary definition with frontline health workers
Crowd Mapping is the crucial participatory process used to define service delivery boundaries by interpreting the local, on-the-ground knowledge of frontline health workers.
Precisely define Ward and Sub-block boundaries on a map using local knowledge and identifiable features.
Union → 3 Wards
Each Union divided for supervision
Ward → 8 Sub-Blocks
Further granular division
Final: 24 Sub-Blocks per Union
(3 Wards × 8 Sub-Blocks)
Union Wise Map Preparation
For Districts
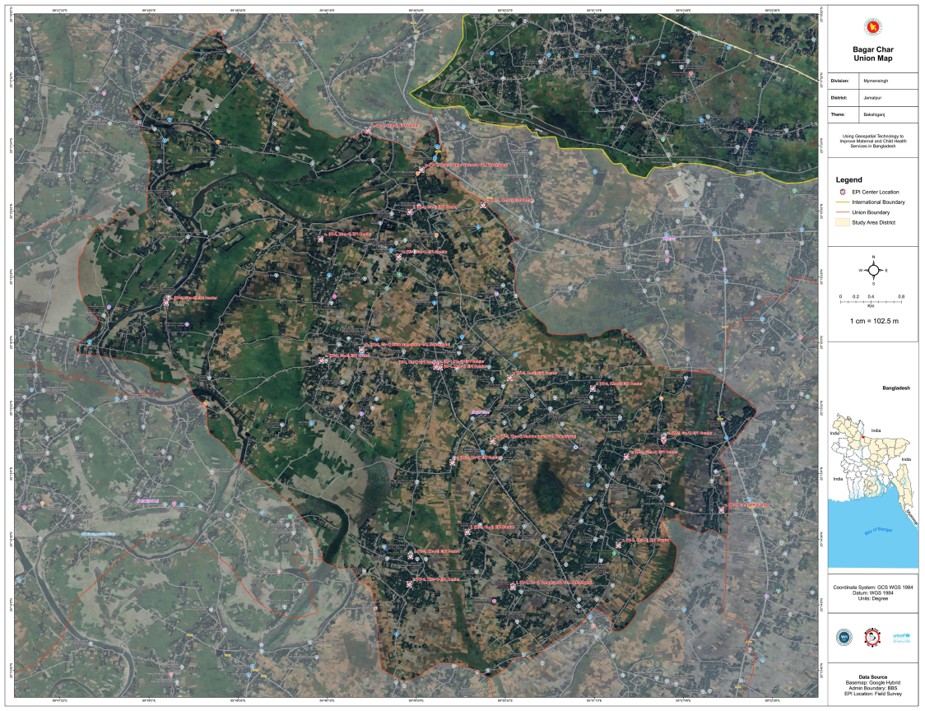
Detailed map preparation at Union level for rural areas, ensuring all geographic features are accurately represented.
Zone Wise Map Preparation
For City Corporations
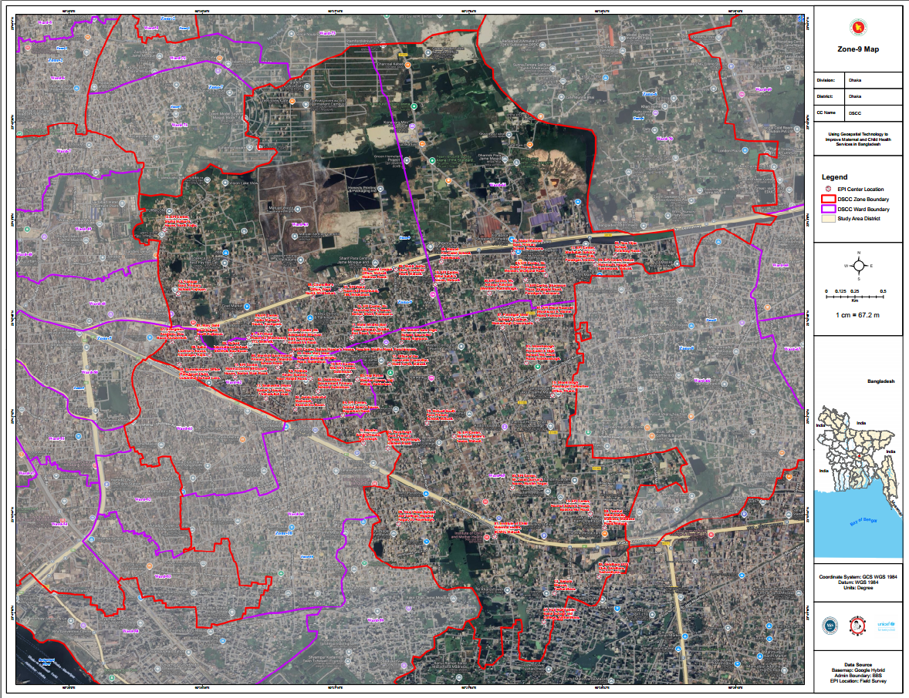
Specialized map preparation for urban areas, focusing on zone-based divisions in city corporation areas.
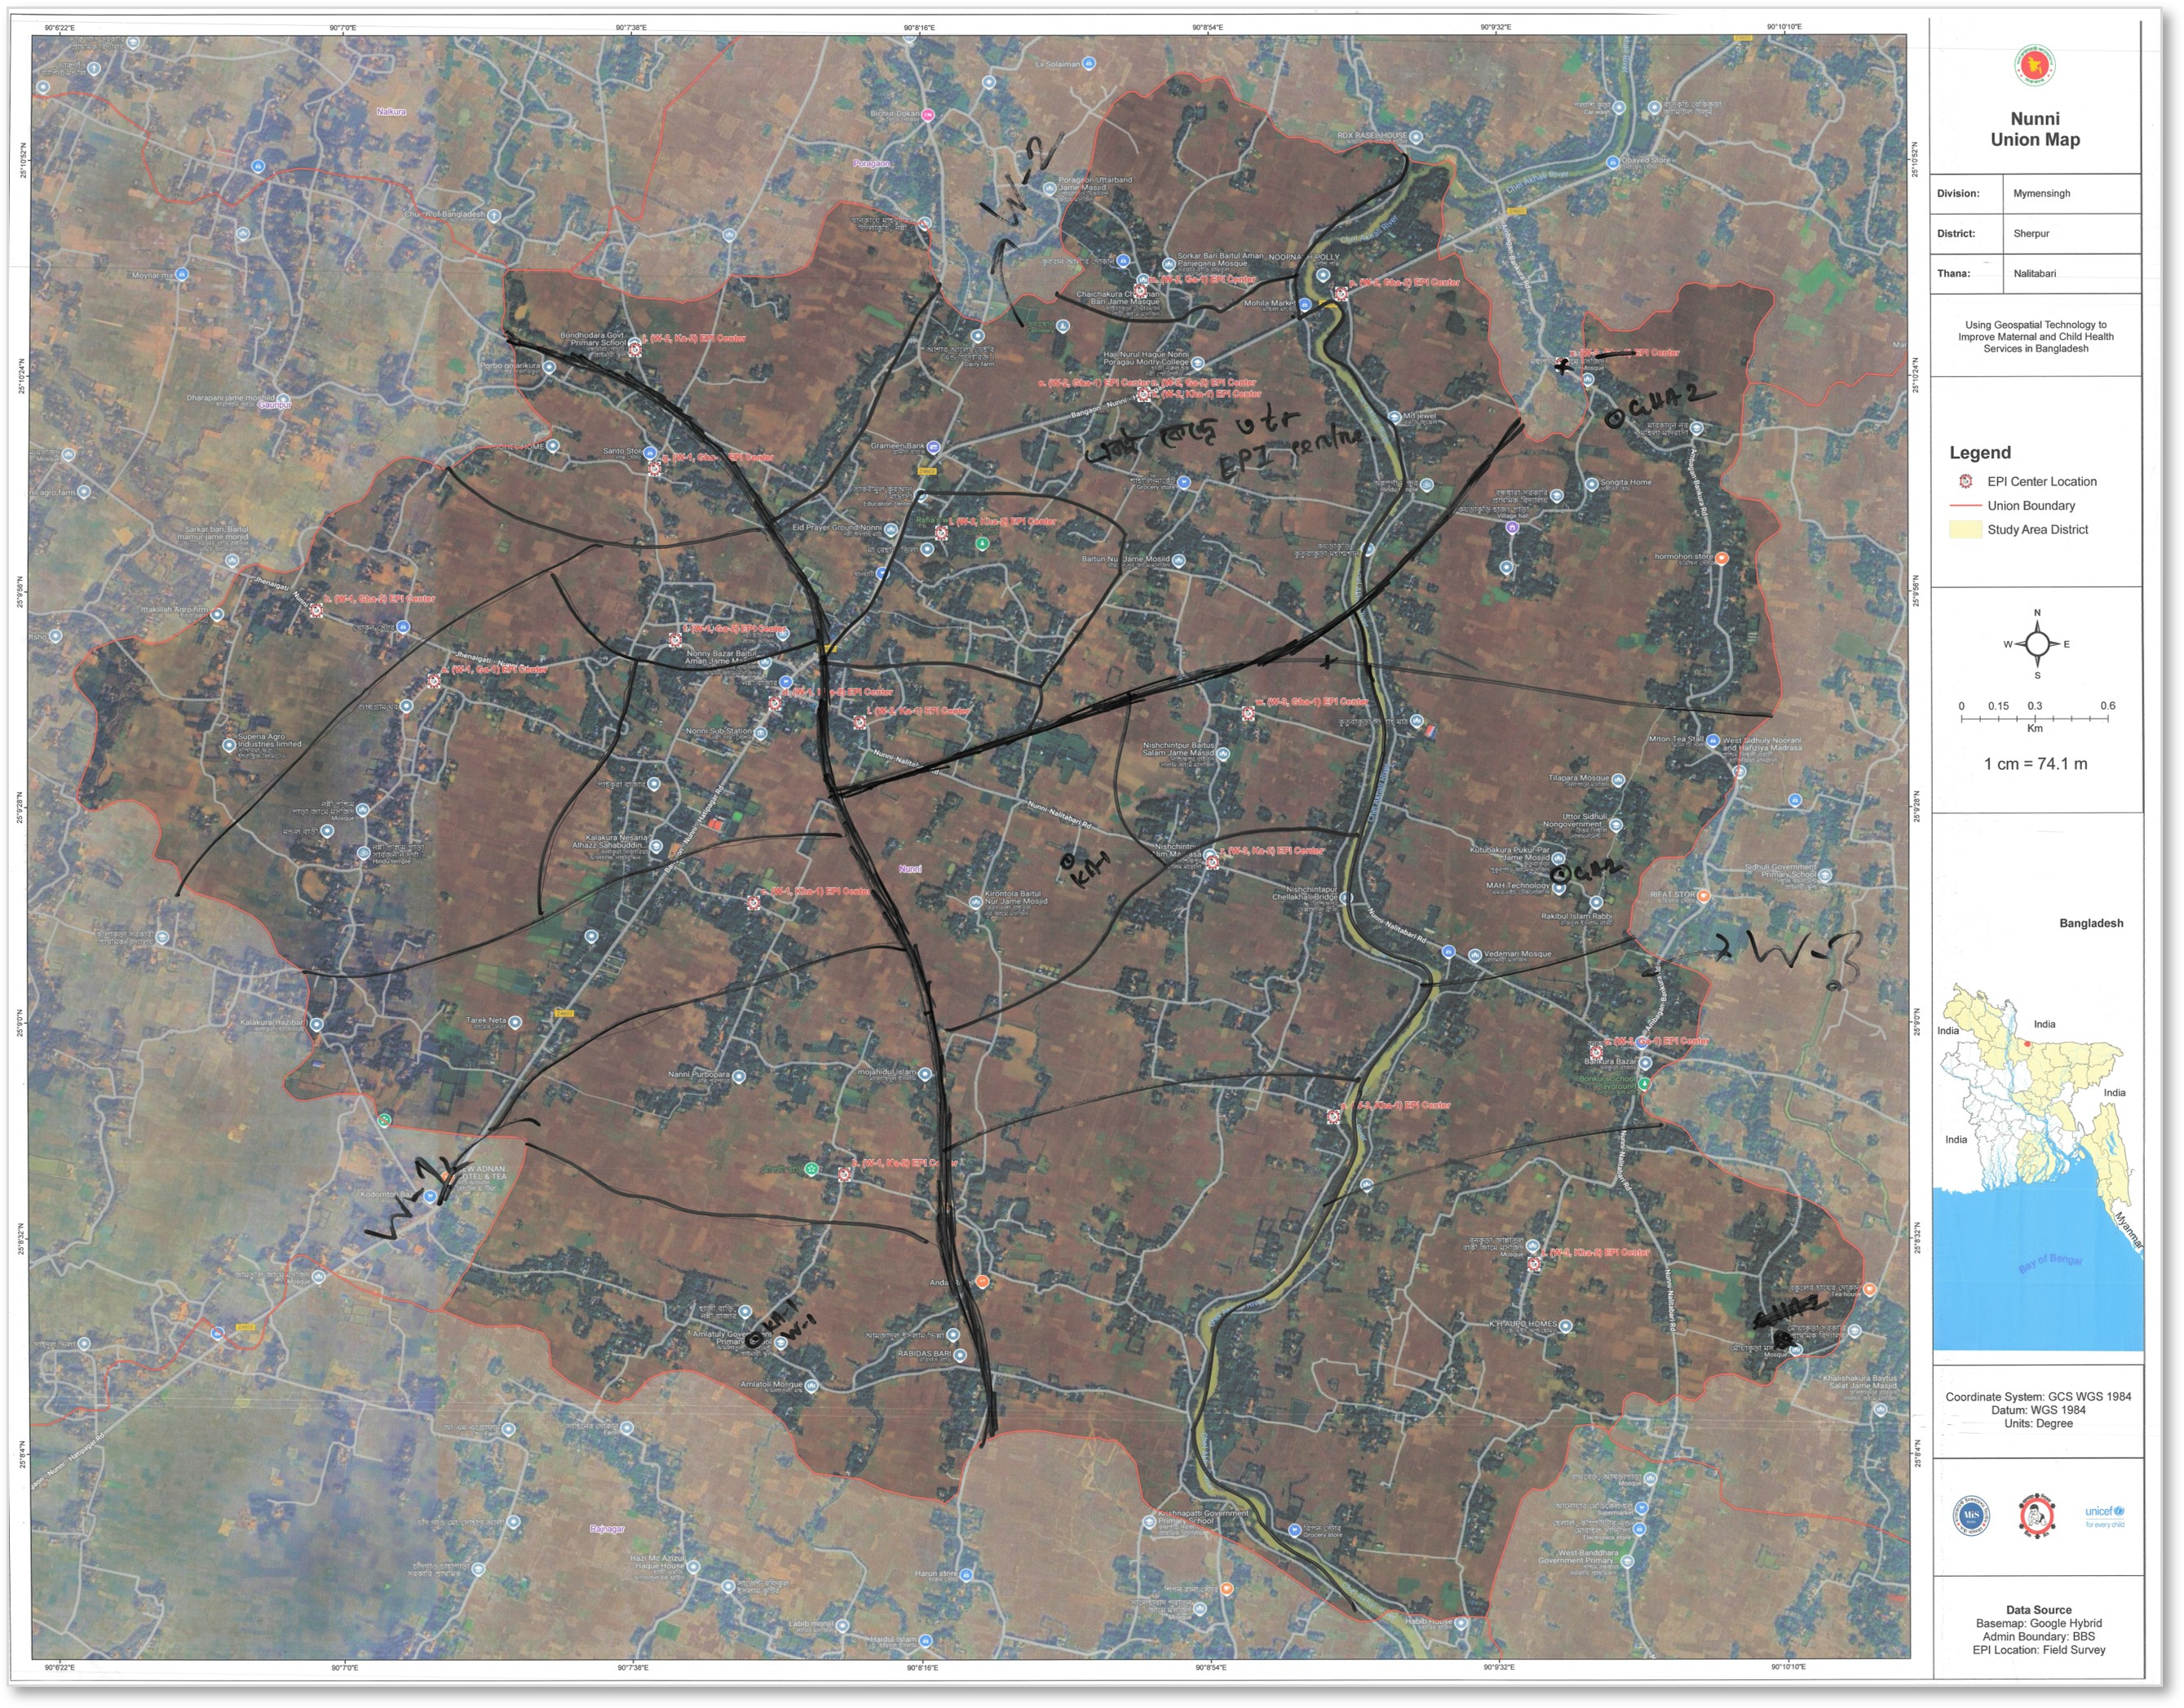
Map Description: Bold black lines indicate ward boundaries, and each ward is divided into 8 sub-blocks denoted by narrow black lines.
Begin the mapping process at the Union administrative level.
A Ward boundary in EPI refers to a subdivision of a Union, created for the purpose of health service delivery management, especially for EPI session planning and supervision.
A Sub-block is the smallest operational geographic unit used in the EPI microplanning system. It represents a cluster of households or population segment that falls under the service area of a specific EPI outreach center.
Final Result: Each Union contains 3 Wards, with each Ward divided into 8 Sub-blocks, creating a total of 24 sub-blocks per Union for comprehensive micro-planning coverage.
Converting field data into digital Geographic Information System
Digitize hand-drawn maps from community mapping sessions into scanned format for GIS processing.
Align scanned maps with real-world coordinates using control points in GIS software.
Create digital vector boundaries for administrative divisions with proper topology and attributes.
Validate digitized data against existing microplanning records for accuracy and completeness.
Add Bangladesh Bureau of Statistics geocodes to enable administrative data integration.
Link DHIS organization unit identifiers to GIS features for seamless data synchronization.
Four primary layers in the geodatabase
Verified administrative boundaries
Supervisory divisions
Service delivery areas
GPS coordinates of EPI centers
Scanned maps from crowd mapping sessions are georeferenced in GIS software, ensuring spatial accuracy and alignment with actual geographic coordinates.
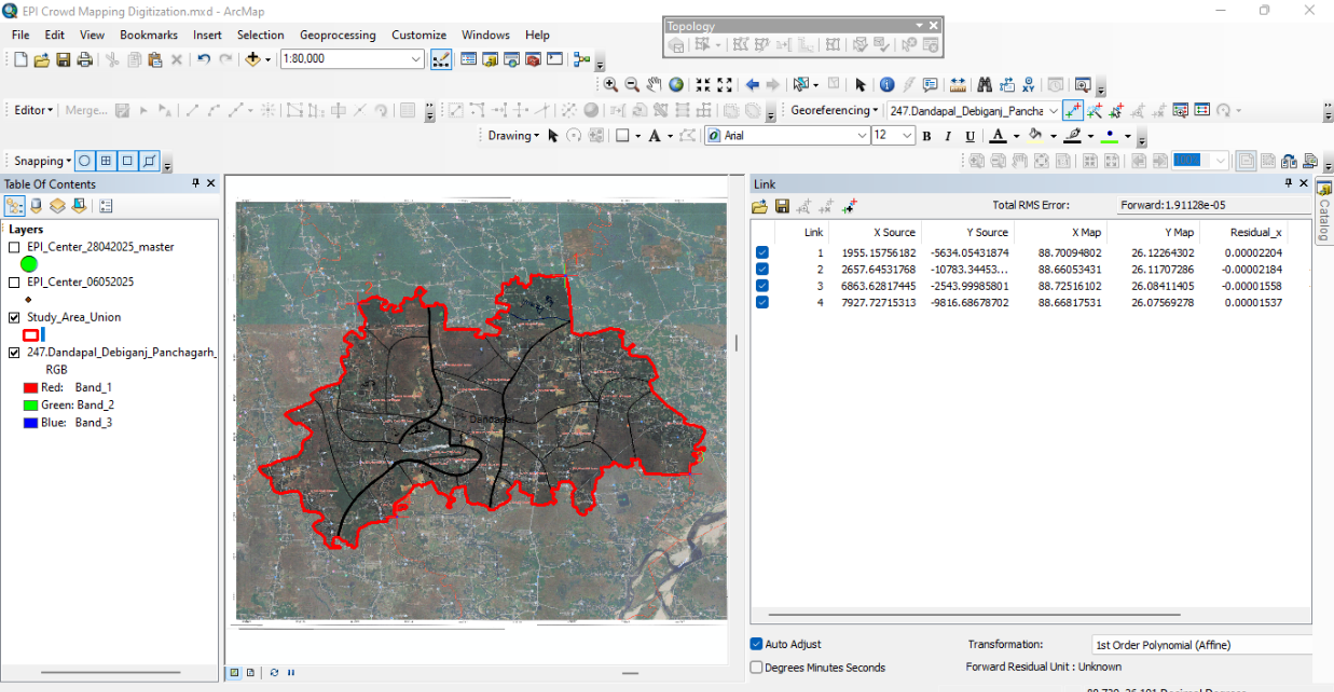
Georeferencing Scan Map on GIS Interface
Field data is digitized into distinct layers, creating a comprehensive multi-layered geographic database for analysis and visualization.
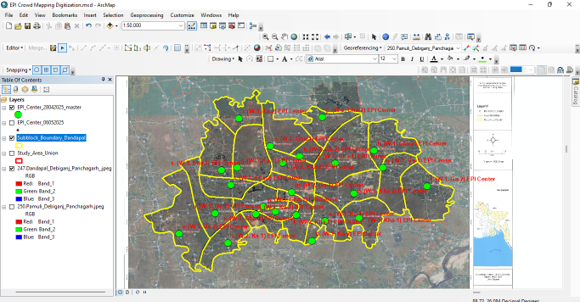
Mapping the Layer of Field Data
Extract, Transform, and Load data for seamless integration
ETL Processing stands for Extract, Transform, Load — a standard data engineering process used to move and prepare data for analysis.
Enable API-driven integration and standardization of nationwide immunization data from DHIS2 and OpenSRP. The ETL process systematically extracts, cleans, and transforms heterogeneous datasets—including administrative boundaries, vaccination coverage, dropout rates, and zero-dose tracking—into a centralized geospatial database for accurate GIS visualization, real-time monitoring, and evidence-informed decision-making.
Automated data extraction via REST APIs (DHIS2 Analytics, KoBo REST API v2), geospatial file parsing (Shapefile, GeoJSON, KML), and scheduled batch imports. Implements OAuth 2.0 authentication, rate limiting, and incremental sync protocols with error handling and retry mechanisms for data integrity.
Geospatial normalization (WGS84 coordinate system), topological validation, attribute mapping, and data quality checks (null handling, duplicate detection, geocoding validation). Executes spatial joins, buffer analysis, polygon aggregation, and calculates coverage metrics (Penta-1, zero-dose indicators) using FME Workbench, GDAL/OGR libraries, and PostGIS spatial functions with Apache Airflow orchestration.
Upsert operations into PostgreSQL/PostGIS data warehouse with spatial indexing (R-tree, GiST). Implements transaction management, referential integrity checks, and optimized bulk loading. Creates materialized views for aggregated metrics, enables real-time dashboard queries, and maintains audit trails for data lineage.
Comprehensive administrative boundaries from Division to Sub-block level with integrated DHIS2/OpenSRP UID and BBS Geocode mapping
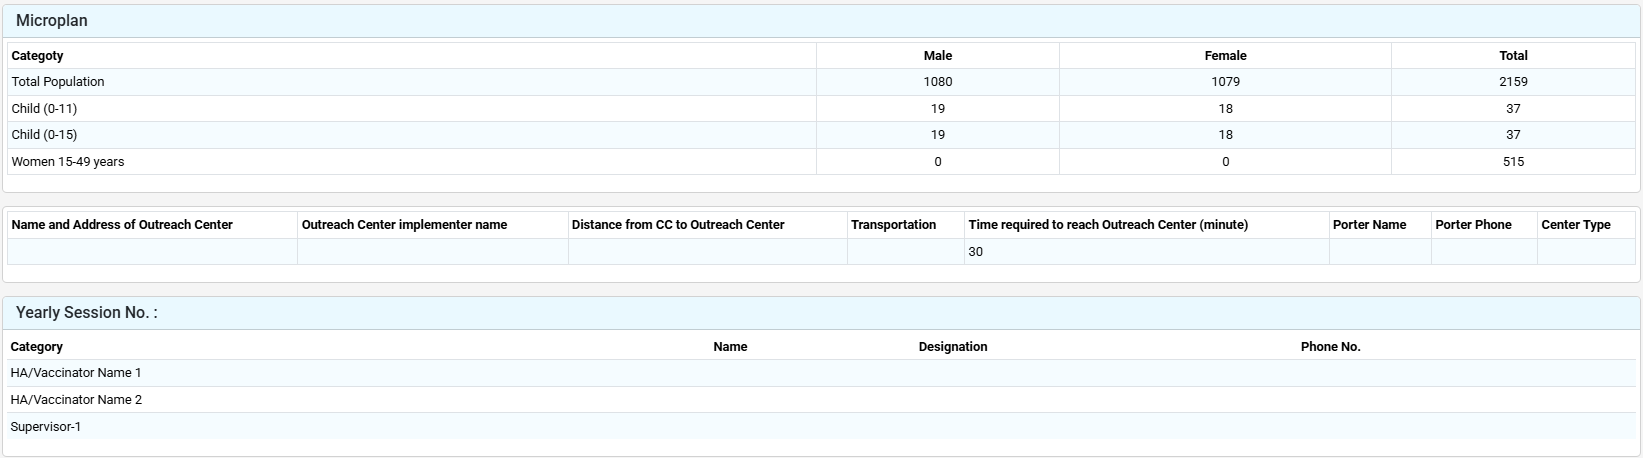
Real-time vaccination coverage tracking: Total Children (0-11 months), complete immunization records for BCG, Penta 1/2/3, and MR 1/2 vaccines
Strategic population demographics (Total Population, Children 0-11m & 11-15m, Women 15-49 years), Outreach Center infrastructure (location, personnel, logistics), yearly session planning, HA/Vaccinator team assignments
Monthly immunization session schedules cascading from Sub-block to District level for optimized service delivery
Normalized PostGIS geodatabase with DHIS2 UID foreign keys, WGS84 (EPSG:4326) geometry columns, and spatial indexes for optimal query performance
Validated EPI performance metrics (Penta-1 coverage, DPT dropout rates, zero-dose children counts) with completeness scores and data quality flags
Integrated multi-scale boundary layers (administrative hierarchies) with health facility point geometries, catchment polygons
Spatial database management
Backend
Data Validation
API Integration
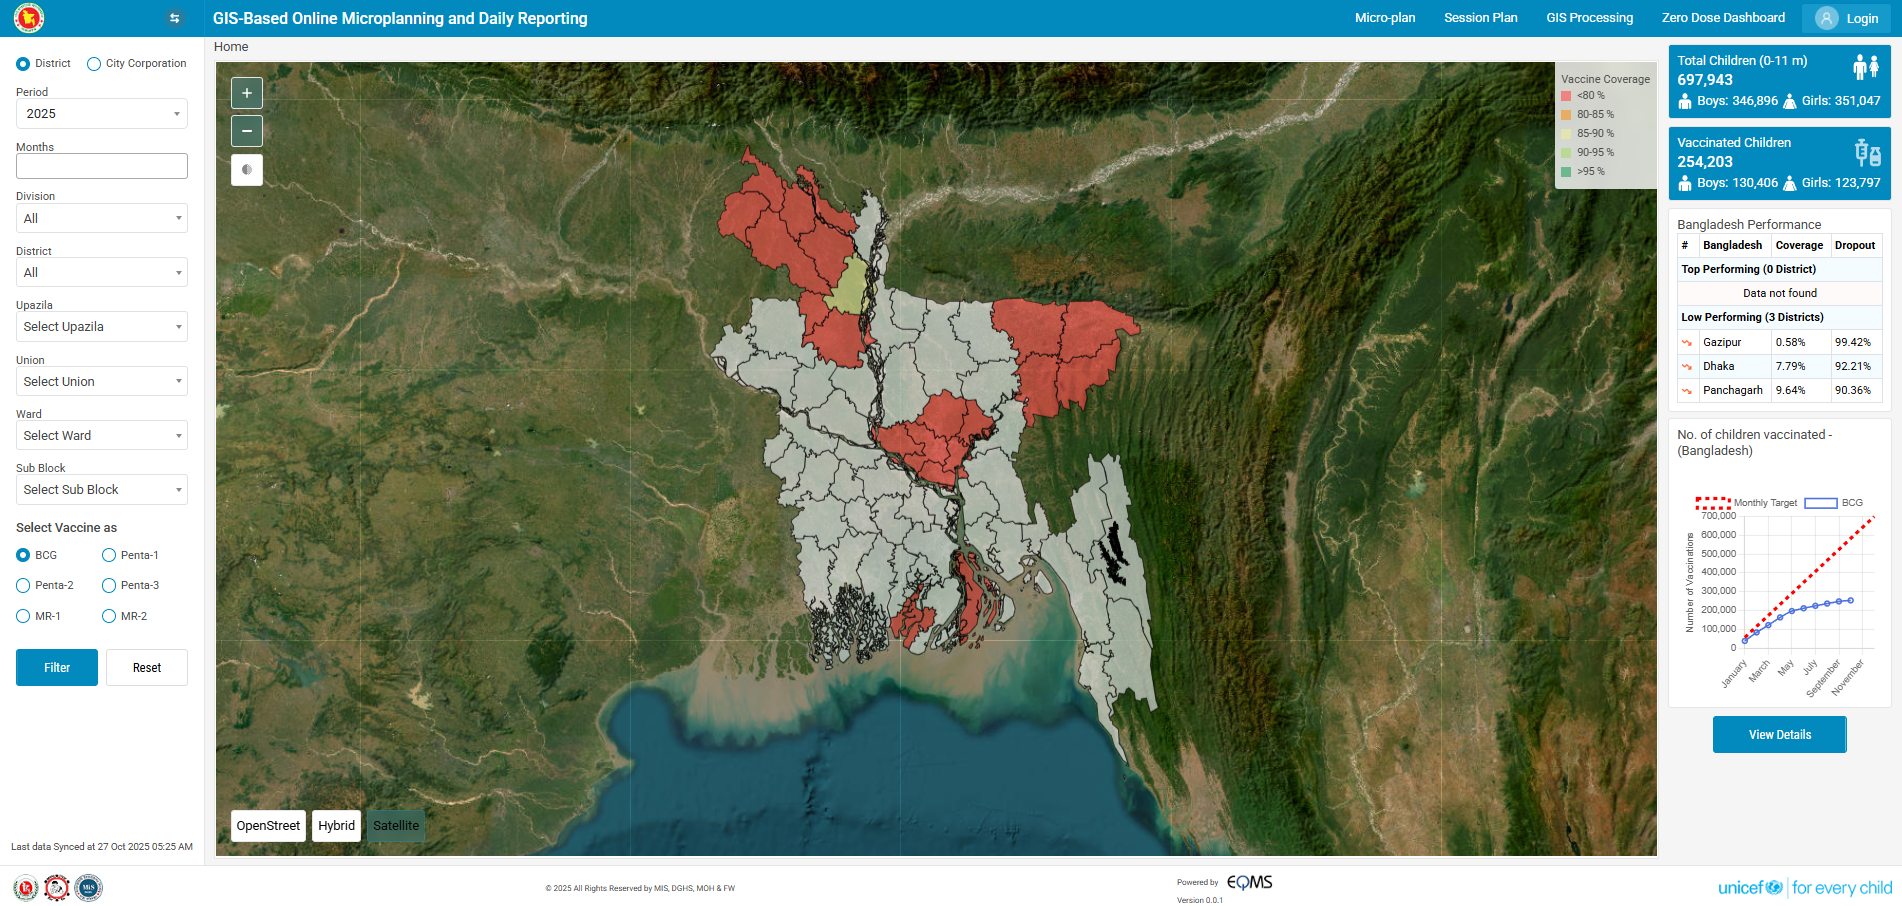
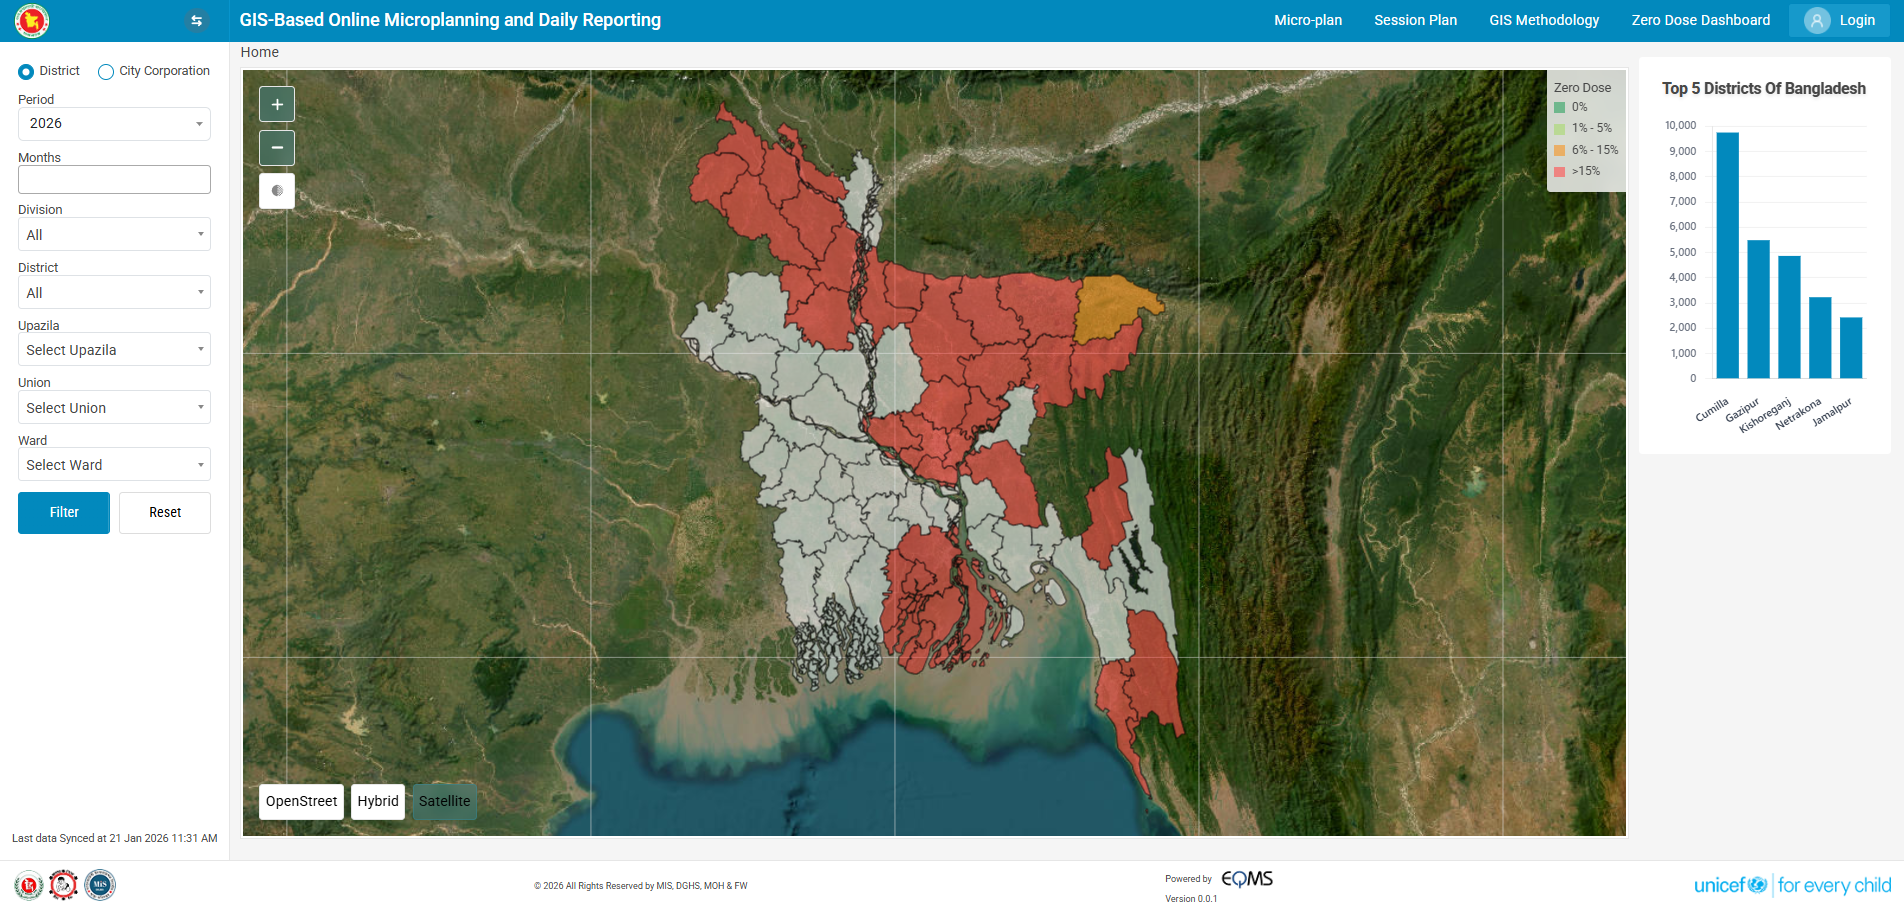
Microplanning and daily vaccination reporting platform

District and City Corporation data included
Year and month can be changed interactively
From Division to Sub-block level filter options
Filter between BCG, Penta-1/2/3, MR-1, and MR-2
Multi-layer interactive mapping with various view options:
Total targeted children displayed based on filter selection
Vaccinated children count updates dynamically
Administrative unit-wise performance table showing top and low performers (<90% coverage)
Target vs. vaccinated cumulative graph by filter and vaccine, month-wise
Vaccine coverage and dropout monitoring by administrative unit
From the Micro-plan menu user can see the Detailed Microplan of the selected Administrative Unit (Division to Sub-block)
Plan and manage vaccination sessions with optimal scheduling, location selection, and resource management.
Track and reach unvaccinated children
Track and reach zero-dose children (those who have not received Penta-1 vaccine) to ensure complete immunization coverage. Zero Dose is calculated as: (Target − Penta 1 Covered) = Zero Dose.
Map Symbology (4 Categories)
Major Outputs & Capabilities
Precise administrative boundaries mapped for effective micro-planning and resource allocation
Comprehensive performance tracking and analysis across all administrative levels nationwide
Strategic mapping of vaccination centers and outreach points for optimal service delivery
Coordinated scheduling and planning for comprehensive vaccination coverage


© 2026 All Rights Reserved by MIS, DGHS, MOH & FW
Powered by

Version 0.0.1
Supported by